First, I wanted to have the list of OIDs and associated data to be slightly better formatted and to update along with the charts. This wasn't too difficult - the chart knows what the data is, so I got it to extend AbstractTableModel and could then simply use JTable to display it, just calling fireTableDataChanged at the end of the loop that updates the data.
(As an aside, I'm irritated that the API doesn't include fireTableColumnsChanged. You can do the whole table, or a cell, or by row, but not by column.)
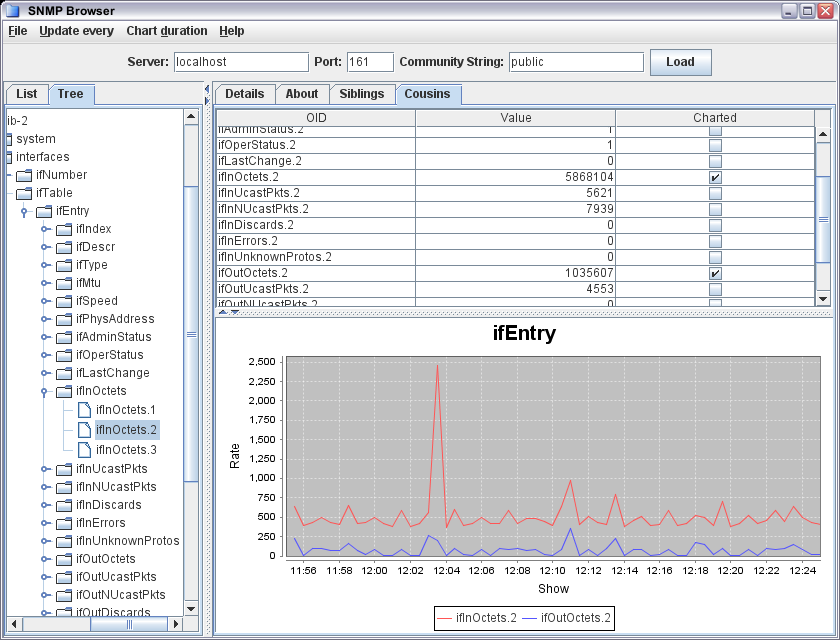
Now, the table is already showing the list of available data, so I just added a third column to handle whether it's displayed in the chart or not. I simply implemented getColumnClass and returned Boolean.class for the third column, and the JTable automatically shows it as a checkbox. (With the value of the checkbox simply toggled from the underlying model.)
The next step was to be able to edit that field - tick or untick the checkbox - and get it to update the chart. The first step is easy enough - just get isCellEditable to return true for the third column.
I then actually got stuck, because the documentation simply isn't clear as to how to connect that all back up. I was looking for all sorts of listeners or event handlers, and couldn't find anything. Searching found a number of threads where someone else clearly didn't understand this either, with responses that were rude, patronising, or unhelpful - from people who regarded the answer as obvious.
Anyway, the important thing is that it really is easy and obvious once you've worked it out. Making the cell editable automatically creates a cell editor, and all the plumbing is created for you. All you have to do is implement setValueAt which gets called when you do your edit. So my implementation simply adds or removes the relevant field from the chart. (And because that's what's supplying the model, the value displayed in the checkbox automatically tracks it.)
That's the sort of basic thing that ought to be covered in documentation but isn't; this blog entry is there for the next time I forget how to do it.
1 comment:
Thanx. I had been stuck around the same issue for a while, now i am getting the desired output.
Post a Comment